When a cyclist starts on a training program, there's an expectation that their training will yield improvements. They should get faster, climb better, become more efficient, or finish higher in the standings. But other than those end goals, how do you measure cycling training improvements in the middle of a training block? And more than that, why would you want to measure cycling training improvements during a training block?
Evaluating your training performance during a training block is hugely important to planning your next blocks of training. If you don't know how your current program is affecting your fitness, how can you adjust it to make further improvements? If you're not improving enough or worse, detraining due to lack of volume or intensity, you need to know that as soon as possible.
Additionally, measuring your improvement during a training block will give you a good idea where you stand in relation to your goals. If your power numbers are way down or your aerobic decoupling is poor, you know there's work to do before you can be competitive. It's sort of a benchmark on the path to your benchmark.
With the “why” out of the way, let's get down to the “how”. Click through the jump to listen to this episode of the Tailwind Coaching Podcast and learn how to measure cycling training improvements in a ton of different ways.
Podcast: Play in new window | Download (Duration: 35:09 — 26.5MB)
Subscribe: RSS
 Measuring cycling training improvements with a power meter
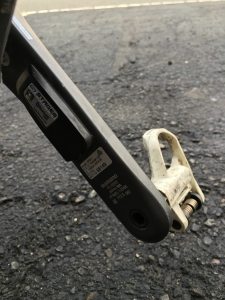
Power meters are amazing tools that have filtered down from the professional ranks to the amateur levels. With tons of options for power meters, even the most amateur racer can start training with power. Once you start training with power, you can evaluate your progress and track your cycling training improvements with power metrics. Picking through loads of data available to power meter users can be tough though. I personally use the following metrics to evaluate improvements in fitness:
Mean maximal power and power profiling improvements
Improvements measured by a power meter are generally based on mean maximal power metrics, which are the bread and butter of power based training evaluations. These are evaluations of the best possible power you can produce for a specific time. MMP measurements can be found in most power analysis software and is a quick way to determine if you're improving.
There are plenty of different MMP metrics to look at, including:
- 10 second power – Sprint power and an indicator of punchiness
- 1 minute power – Zone 6 and anaerobic power
- 3 minute power – Short duration Zone 5/VO2 max power
- 5 minute power – Medium duration Zone 5/VO2 max power
- 8 minute power – VO2 Max limit
- 20 minute power – Threshold “estimation” and aerobic
Each one of these MMP measurements is important in its own way. For more information on these metrics, check out my articles on VO2 max intervals and the science of high-intensity training.
If you're not sure how to go about testing these, you can find protocols for testing them in my Z4/5/6/7 power test program.
Power profiling is a method of evaluating what you're “good at” as a cyclist. It will tell you where you're strong and where you're weak. Because of that, you can use a power profiling to determine where to focus your training time. You can also use it to evaluate training improvements. If you graph your power profiling over the course of several weeks/months, you can see rises in different power durations on your profiling. This “flattening of your profile” is a simple way to figure out if your training is working or not.
Efficiency factor improvements
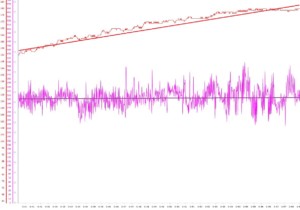
Efficiency factor is a simple metric that's calculated by most power evaluation software packages. Mathematically, efficiency factor is normalized power divided by average heart rate over the workout. It seeks to evaluate the relationship between your power production and your heart rate, similar to aerobic decoupling.
Compared to aerobic decoupling, efficiency factor is a measure of how well your body can convert fuel into energy. It's also a measure of how efficiently your body uses that energy to put power into the pedals. How do you use it to determine if you're improving? EF measures, when compared over time for similar intervals (with similar equipment, routes, weather, etc) can give you an idea of how you're improving.
Generally, if you're making good progress with your aerobic development, you'll see improvement in your EF.
 Aerobic decoupling improvements
I talked about aerobic decoupling extensively in my “What is Aerobic Decoupling” podcast. But for the sake of convenience, let's talk about it here. Aerobic decoupling is a phenomenon that stems from muscle fiber fatigue and recruitment of additional fibers. As muscle fibers get tired and can't put out continual effort, your body has to recruit more and more fibers to maintain the same power output. Recruiting more muscle fibers means more energy is required, more blood flow is needed and more metabolic waste is created.
As you become more efficient and your body becomes more fatigue resistant, you'll recruit fewer muscle fibers during long efforts. You'll require less blood flow to maintain the same intensity. That means less stress on your cardiovascular system and less heart rate drift.
Measuring cycling training improvements with heart rate, speed, and RPE
Improvements measured by heart rate
If you only have heart rate to measure your training improvements, you've got a couple options. Watching heart rate averages over known routes can give you an idea of improvements (see above aerobic decoupling and efficiency.) Pick a route, ride it, then re-ride it a few weeks later. Pick a day where your routine is about the same, the conditions are about the same and you've fueled the same. Guage your RPE and pick something that feels similar. Changes in HR will tell you if you've been improving.
Improvements measured by speed
Changes in speed can be useful for measuring improvement in your cycling training. Look for increased speed over a known loop or segment. This is highly dependent upon ambient conditions (they should be as similar as possible during each testing period.) You should be able to record via GPS, or at minimum, speed, cadence and time.
This metric is best used in conjunction with heart rate and RPE. By combining them, you'll have several metrics that you can weigh against each other. For example, a faster speed at the same HR, lower HR for the same speed, or a faster speed at the same RPE all show improvements.
 Improvements measured by RPE
RPE is a very important metric to track. By tracking how you perceive the effort, you can determine if you're improving or not. This is especially true when you combine it with heart rate, speed or power. Because RPE is subjective, it can sometimes be a little bit off in terms of pure objective data. However, it does have a lot of value when compared to those other solid data points.
Note that you can use RPE over an entire ride, a specific loop, a short segment or even a single terrain feature like a climb. It's also very valuable to track RPE during dedicated power testing, as minute changes in power can lead to huge changes in RPE.
 Measuring improvements using real-world performance
Well, maybe Strava and Zwift aren't really “real world” performance. But they do have a lot of value for measuring improvements. Using Strava involves testing over known segments or loops, privately designated loops and segments, as well as KOM tries. Be careful and don't let Strava become an obsession that ruins your fitness. If you're using it as a measurement tool, use it for that specifically and don't get caught up in the virtual competition with others.
Zwift is a perfect way of measuring minute improvement because the ambient variables are controllable and your resistance on the trainer is constant. As I mentioned before, controlling outside variables is important for consistency. Zwift not only allows you to do this by placing you indoors, you control the atmosphere around you. Set the temperature, ride at the same time of day after the same nutrition, with the same fans and your data will be more controlled.
In terms of competition, racing is perhaps the best measure of fitness. Time trials are especially good since they are a singular effort that depends on your own fitness, not any other outside factors. You can add to the repeatability by comparing your results with those who you frequently race with as well. So if you've consistently been beaten by a great sprinter, closing the gaps in placings between the two of you is a great measure of training improvement.
Finally, for those of you who are more interested in group riding and fondos, you can still get some measures of improvement. Performance on group rides (especially relating to how long and fast you can pull, how well you recover in the group and how you hold up to long days in the saddle) is a great metric to track improvement with. The more you ride with people and the stronger you get, the more you'll be able to put the hurt on them.
How frequently do you measure training improvements?
Improvements can be measured on any given ride. However, you shouldn't put too much stock in day-to-day changes. Changes over time are the key to noting improvement. (you don't see your hair grow a millimeter each day, but after it gets 2 inches longer you notice, training improvements are the same.) Typical testing is performed every 4-6 weeks to give objective data. That objective data is important to effectively modify your training to elicit the desired improvements.
Too frequent of an evaluation and you don't give time for your body to adapt and adjust. Too long and you leave potential gains on the table. So be smart with your measurements. Start with a baseline and measure yourself every month or so, making small changes to your program when necessary
