Is it possible to use training stress score and a few other derived metrics to manage your fatigue? Can you simply know how hard to ride by just looking at a number on a computer screen?
I recently answered a question from an athlete that went something like this: Lisinopril otc
“I've been doing riding four days per week (2 trainer days and 2 outdoor days.) I've been following this pattern for about 6 weeks now and I've noticed in the last week that I've been extremely tired and been feeling worn out. Have I been training too hard?”
This question is an excellent illustration of why training with power can be so useful: Training Stress Score (TSS) and Intensity Factor (IF) can be calculated from accumulated power data. These metrics, when combined with a performance management chart will allow athletes to calculate Training Stress Balance and can help determine when overtraining becomes a danger. It can also help you vary the intensity of your workouts and tailor them to your training needs more appropriately.
As a side note, TrainingPeaks online and Strava offer some variety of TSS as well, calculated via heart rate. That's another blog post entirely, so keeping in mind that we'll be discussing power based metrics, let's look at how you evaluate training stress and fatigue after the break: https://nonnieestellamd.com/flagyl-over-the-counter/
 Definitions
To understand the performance management chart, we first have to understand a few things that we're reading on the performance management chart. You'll also find that most of these data points are byproducts of riding and training with power, so you'll also need a power meter like the Stages power meter.
Intensity Factor (IF)
Intensity factor is a simple calculation comparing normalized power to Functional Threshold Power (FTP). (Normalized power is “an estimate of the power that you could have maintained for the same physiological “cost” if your power output had been perfectly constant rather than variable.” Basically, if you pedaled the entire ride at a steady pace, with no variations for climbs, descents, etc, this is the average power you would produce.) What's important to note about IF is that it helps you to determine how difficult a particular ride or workout has been, and helps you to gauge how specific your training has been. Take a look at the following IF scores: https://nevyhealth.com/amoxil-500/
- Less than 0.75 = (Power Zone 1) = recovery rides
- 0.75-0.85 = (Power Zone 2) = endurance-paced training rides
- 0.85-0.95 = (Power Zone 3) = tempo rides, longer (>2.5 h) road races
- 0.95-1.05 = (Power Zone 4) = shorter (<2.5 h) road races, criteriums, circuit races, longer (~40 km) TTs
- 1.05-1.15 = (Power Zone 5) = shorter (e.g., 15 km) TTs, track points race
- Greater than 1.15 = (Power Zone 6) = prologue TT, track pursuit
As you can see from the values, IF roughly follows power training zones, and you can use this to determine if your ride/workout was within your requirements by looking at the IF. For example, if your training plan calls for a Tempo ride with muscular endurance intervals and maybe a few threshold intervals, you would expect to see and IF between .85 and .95 (probably closer to .95 due to the threshold intervals.) If you see an IF of .78, you know that your training was decidedly not hard enough that day (or if it *felt* hard but still resulted in a .78, perhaps your body is excessively fatigued and you're unable to perform at a higher level without some rest.) Consequently, if you have a day scheduled that should be endurance work with spinups or single leg drills, yet results in an IF of .88, you've trained too hard that day.
By using these IF values, you can temper your training intensity on a day to day basis and keep your training on track. You can also use your IF scores to determine if it's time to re-test your threshold. Consistently breaking into IF scores over 1.0 (for longer training and racing efforts, of course) generally means that your FTP is set too low, and it's time to go out and test again. While it's true that these “normalized power busters” can occur with a properly set threshold, it's extremely tough to do.
Now while IF is a valuable tool to find out if your training is on track, determining fitness and fatigue is best accomplished with Training Stress Score.
Training Stress Score (TSS)
While IF can help you to track and manage individual workouts, TSS will be your guide towards fatigue and fitness building. TSS is based on Andy Coggan's idea that a 100% FTP effort for 1 hour will equate to 100 TSS. If you complete a workout that is 95% FTP for 1 hour (a time trial for example) then you would rack up 95 TSS points. You can also tie into the RPE (Rating of Perceived Exertion) scale by assigning 10 TSS points to each RPE, per hour. So, for example if that 1 hour time trial felt like a 9/10, you would rack up 90 TSS. Note that these values are the same if you're a ProTour rider or training for your first race or triathlon: TSS is based upon YOUR functional threshold and the time spent at a fraction of that threshold. In this respect, you can see that using a power meter and determining your actual power outputs, interval times and rest times gives you a much more precise value for your TSS.
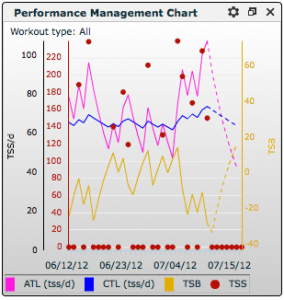
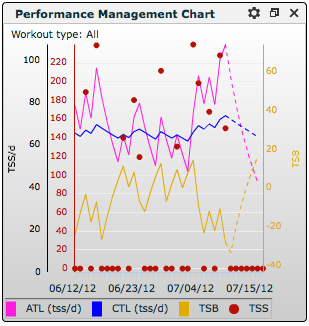
Ultimately, TSS values are the most useful when using them to gauge fatigue and gauge fitness increase (through use of a performance management chart.) These charts are available in WKO+, TrainingPeaks and many other power meter software bundles.
(Huge sidebar coming: However, TrainingPeaks and Strava have the capability to calculate TSS via heart rate, so those of you without power meters are not left out in the cold. Particularly with TrainingPeaks, the performance management chart will display your fatigue, fitness and training stress balance (time to recovery) using only heart rate data.)
In terms of measuring fatigue and determining how much recovery may be needed after a specific effort, your TSS value for a specific workout can be your guide. Since TSS is based upon generalized exercise physiology, assumptions can be made about the recovery necessary from an effort of that intensity. Knowing that, you can follow the general guidelines below:
- <100 TSS = Low (Easily recovered by the following day)
- 100-200 TSS = Medium (Some residual fatigue present the following day, gone by 2nd day)
- 200-300 TSS = High (Residual fatigue usually present after 2 days)
- 300-400 TSS = Very High (Residual fatigue lasting 2-4 days likely)
- 400+ TSS = Epic (Residual fatigue requires 5 days to dissipate)
Note that you may need more or less recovery depending upon the amount of fatigue your body was dealing with prior to undertaking a specific workout. You know that doing back to back hard workouts leaves you more tired the following day, and that's a result of accumulated TSS and fatigue. Your body needs time to adapt to stimuli in order to recover and improve, and that's why rest is so important and timing of rest days is so important.
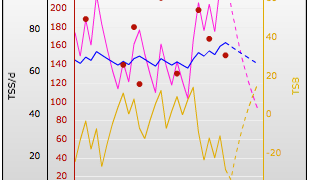
Fortunately, we can quantify how stressed our body is by using another metric found on the performance management chart, training stress balance.
Training Stress Balance (TSB)
Another important part of quantifying fatigue and training stress is a metric called Training Stress Balance (or TSB for short.) Training stress balance is a combination of CTL (chronic training load) and ATL (acute training load.) Generally speaking, a positive TSB means your body is “fresh” and is primed for a good performance. A negative TSB would suggest that your body is fatigued and may be a little bit dull.
Quite simply, with CTL and ATL being the determinants of TSB, the higher your CTL (or fitness, if you want to look at it that way), the more room you have to work your training under your CTL and maintain some kind of form. If your CTL is quite low, then significant ATL (fatigue) will offset your fitness and your form will suffer. Your body will be too fatigued to perform at a high level, so you need to plan and moderate your TSB so that it is positive come event day.
Finding the exact TSB that results in a high quality performance requires some trial and error, however. You'll have to record your data, your results and how you felt, along with any pertinent placings. After doing that, you can go back and evaluate performances to figure out how you perform the best.
Considerations
It's worth noting that while TSS is essentially normalized to your individual FTP (essentially to allow for comparison across individuals of varying ability) there may still be differences in how you respond to a given training load vs. another athlete. These differences may be due to natural abilities, specific training and genetic predisposition. When it comes down to it, this really isn't much of an issue, since your main goal is comparison within your own results to determine changes in your fitness.
It's also worth noting that all the IF, TSS and TSB data is useful, but charting it manually is really very difficult. In the short term, you can look at IF, TSS, and TSB to determine if you're on track for the week or if you need to take a day or two off your training. In the long term, you're far better off utilizing a PMC (Performance Management Chart) from TrainingPeaks, WKO+, Golden Cheetah or any of the other training programs out there. And of course, if you're not up for dealing with the ins and outs of analyzing your PMC, TSS and IF values and determining the right direction for your training, you can always consider utilizing the services of a qualified coach to help you out.